

Disclaimer: The package “Salesforce Chart Composer” and this blog “Salesforce Guides” are both initiatives of Talha Saqib. This blog post will serve as the official documentation of the product.
What is Salesforce Chart Composer?
Salesforce Chart Composer is an unmanaged package to create various kinds of charts using Salesforce records. The product is suitable for both developers and admins as it utilizes the standard Salesforce user interface to create Chart records while also giving the option to write Custom SOQL. The charts produced through Salesforce Chart Composer can be placed on Apps, Records, and Homepages.
The complete project is available publicly on GitHub.
Getting Started
Following are the steps to get you started on the Salesforce Chart Composer package.
Installation
- The first step is to install the unmanaged package of Salesforce Chart Composer from this link.
- Go to Permission sets and search for “Salesforce Chart Composer” permission set and assign it to the desired set of users.
Create Sample Records
- Before creating a chart, there must be some sample records in the org. For this example, create a set of Account records with the standard field NumberOfEmployees filled randomly.
Create a Chart record
- Create a new “Chart” object record. Check out the complete details of this object from this page.
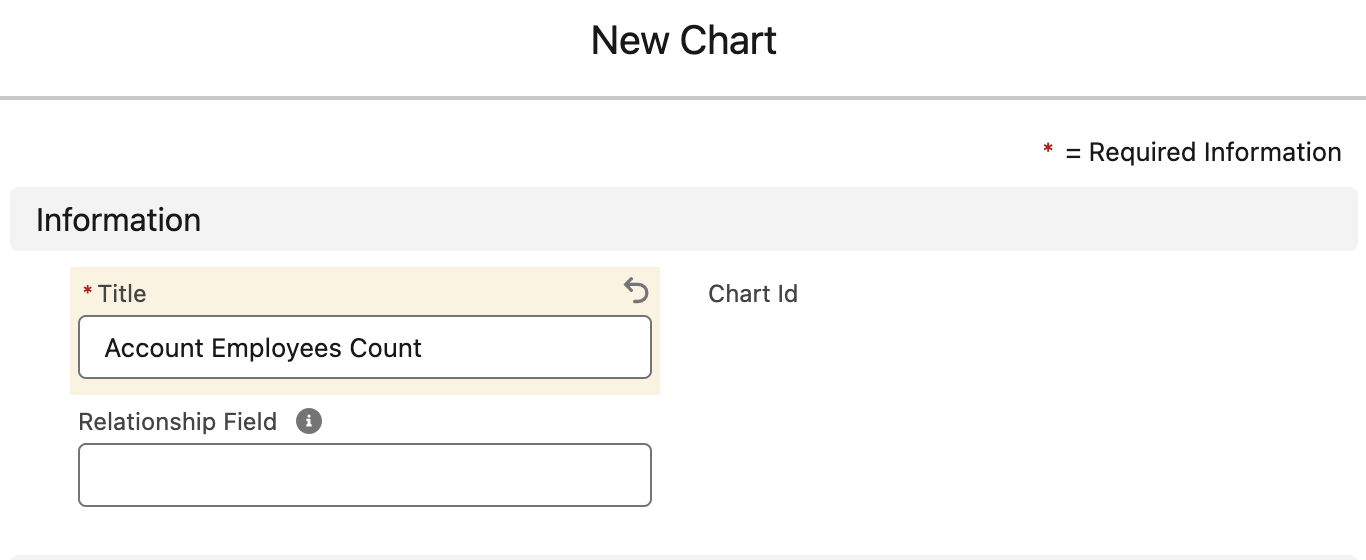
- Fill the Title field with “Account Employees Count” and leave the Relationship Field blank for now.
- Click Save.
- Copy the auto-generated Chart Id value.
Create a Dataset for Chart
- Open the Chart record and create a new Chart Dataset object record from the related list.
- Fill in the Dataset fields as mentioned below.
| Field | Value |
| Dataset Label | Number of Employees |
| Chart Type | Bar |
| Source Object | Account |
| Source Field | NumberOfEmployees |
| Source Label | Name |
| Records Limit | 50 |
| Sort By | NumberOfEmployees |
| Sort Order | Ascending |
| Border Color | black |
| Border Width | 1 |
| Background Color | pink |
- Leave all other fields as default.
- Click Save.
We can also create more related Dataset records for a single Chart record but for this example, we will only use one dataset.
Add Dynamic Filters (Optional)
Although the chart is now ready to be rendered, we can optionally add extra filters to the dataset. For that:
- Create a new Chart Filter record from the Filters related list on the dataset record page.
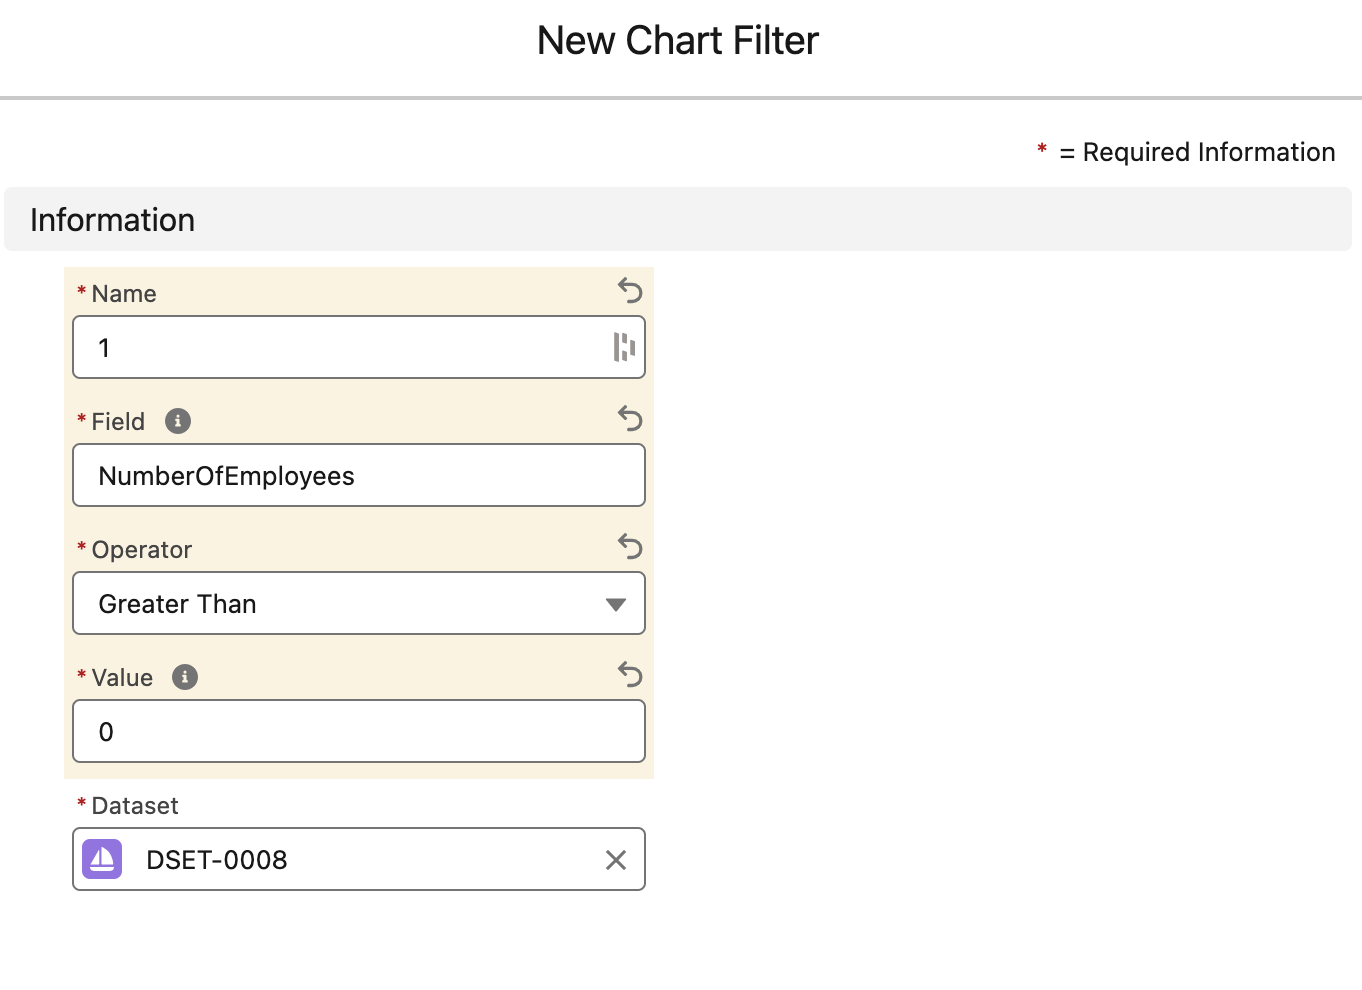
- Use the following values to create the Chart Filter. Set Field as “NumberOfEmployees“, Operator as “Greater Than“, and Value as “0“.
For best practices, name your filters as numbers e.g. 1, 2, etc.
Add Chart Component
Finally, add the chart to any of the following pages:
App Page
Home Page
Record Page
- Click the Gear icon on the top right.
- Click “Edit Page” to open Lightning App Builder
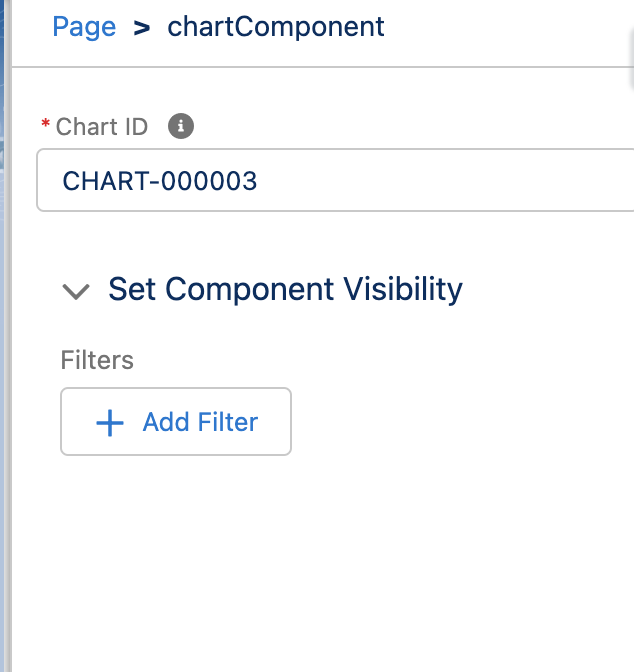
- From the custom components, select “chartComponent” and drag to the page.
- Paste the copied Chart Id in the respective input bar.
- Click Save.
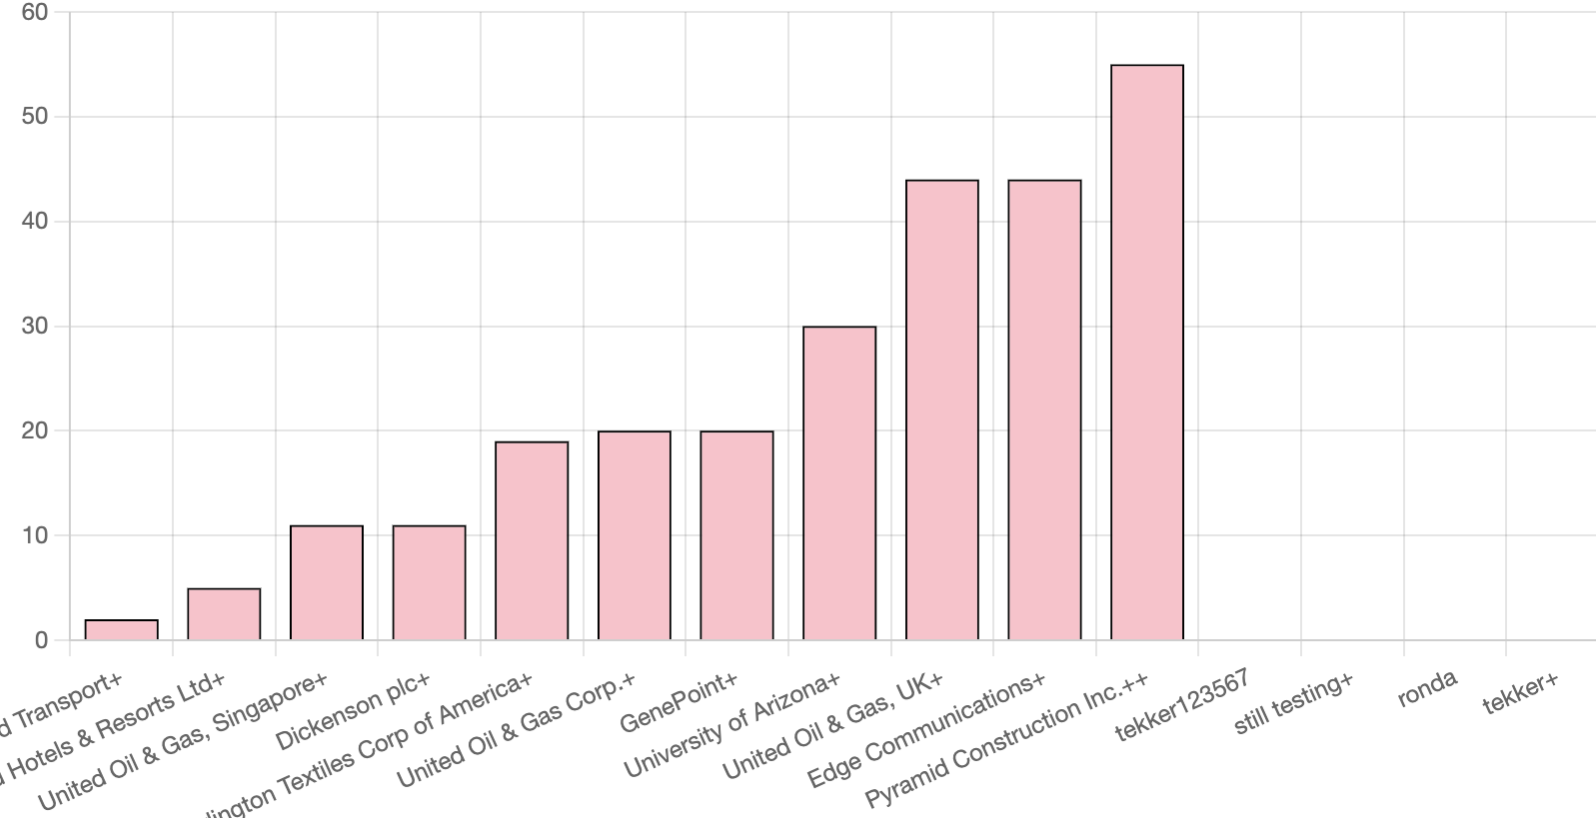
A similar chart as shown below should be rendered.
Next Steps
The Salesforce Chart Composer has more to offer. Read the following resources to familiarize yourself with more features.


Larry
April 5, 2024Impressive!
WIll it work on a visualForce page … Rendered as PDF ?
Talha Saqib
April 5, 2024This is essentially an LWC, therefore wherever LWC is supported, this should work as well.